Reading the Dashboard
Moth DocsApps
The Dashboard puts the account on one page, with when you call, what is left, what you spent and saved, and your latest calls and keys.
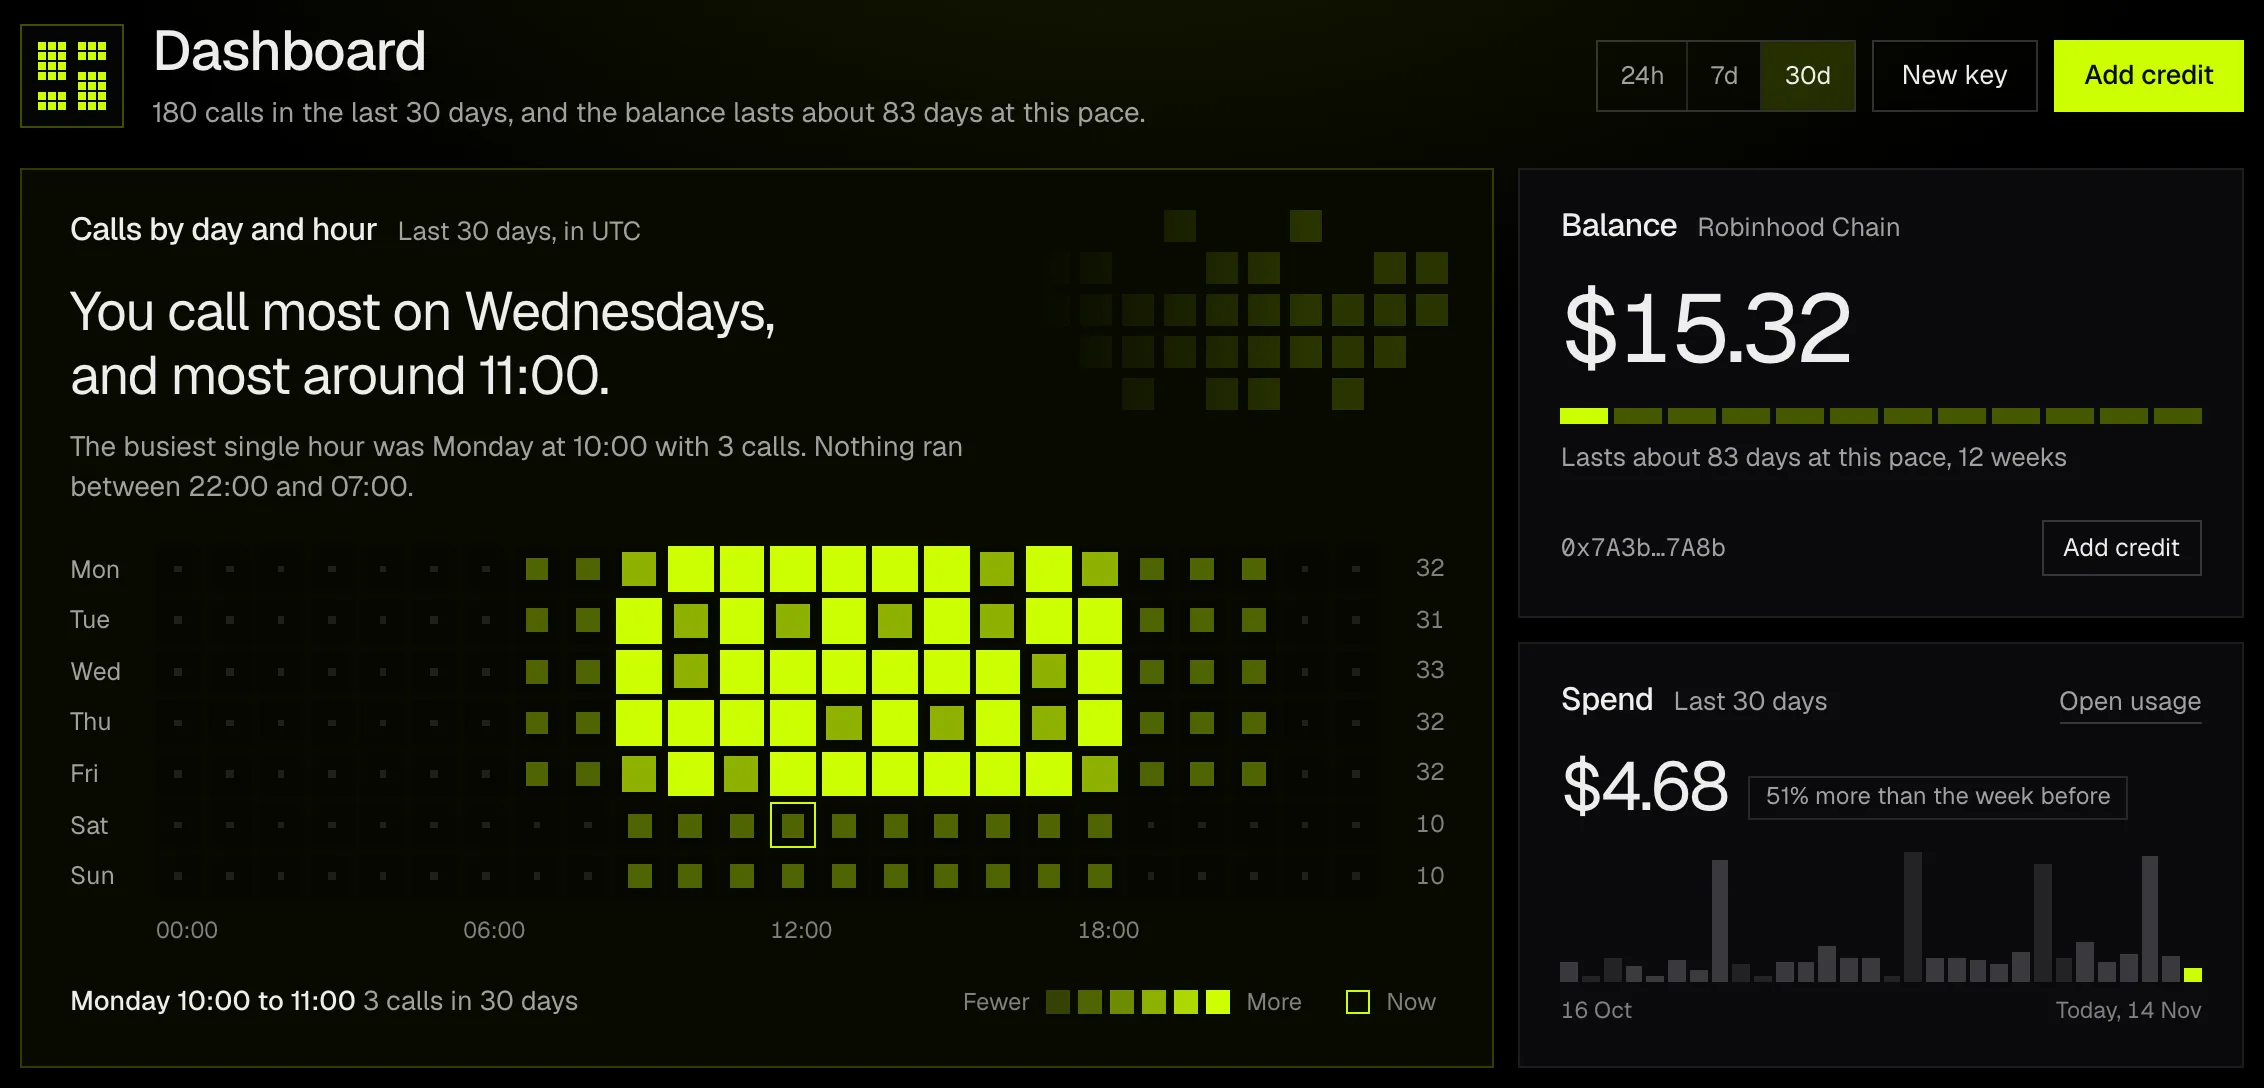
The line under the title says the month in one sentence, with how many calls you made in the last 30 days and how long the balance lasts at this pace. The title row also holds the range, New key and Add credit.
The heat map
The large card is the last 30 days of calls by weekday and hour, in UTC. It has one square for each hour of each weekday, seven rows of 24, and a square grows and brightens with the calls made in that hour. The sentence above the grid names the day and the hour you call most, then the busiest single hour and any stretch of the day in which nothing ran.
- Point at a square, tap it, or walk the grid with the arrow keys, and the line under the map reads that hour and its calls.
- The hour it is now carries a lime ring.
- The figure at the end of each row is that weekday's total.
- An account with no calls yet sees the same grid unlit, with a link to create a key.
Balance and how long it lasts
Balance is what is left after the holds still open. Under the figure a strip lights one square for each week the balance lasts, up to 26, and the line says the same in days. The pace is the spend of the last seven days divided by seven, so a week with no spend shows no pace. Add credit opens the Credit page.
Spend, calls and tokens
Spend and Calls and tokens follow the range in the title row. Spend adds up the range and draws it as bars, one for each day, or one for each hour when the range is 24h, and a bar reads its own figure when you point at it or reach it with the arrow keys. Calls and tokens counts the calls and the tokens in and out, where chat calls count tokens and media calls count what they made. Both cards compare the last seven days with the seven before them once there is a week to compare with.
Saved against list
Saved against list is what your calls of the last 30 days would have cost at the makers' published list prices, less what they cost with Moth. The share under list price is rounded down, so it never reads higher than it is. Spend by kind splits the same 30 days across chat, image, video and music.
Three cards always cover 30 days. The heat map, the saving and the spend by kind cover the last 30 days whatever the range says, and each card says so.
Recent calls and keys
Recent calls lists the seven latest with the model, the key or app that made each, its size, its time in UTC and its cost. A call that failed shows its status in place of a size and a cost of $0.00, and a rate-limited call reads not run. Prompts and replies are never kept, so there are none to show. Open logs leads to every call.
Keys shows up to three keys with what each has spent of its cap, the spending ones first. A key paused with a cap of $0 says so, and a key with no cap says it spends from the whole balance. Pressing a key opens it on the API keys page.
At the foot, Models you call shows the three models you spent most on in the last 30 days and one you have not called with the largest saving against list. An account with no calls sees Models to try in its place.
While a card loads it shows a shimmer at its final size, and a card that cannot be read shows a dash and says it is retrying.